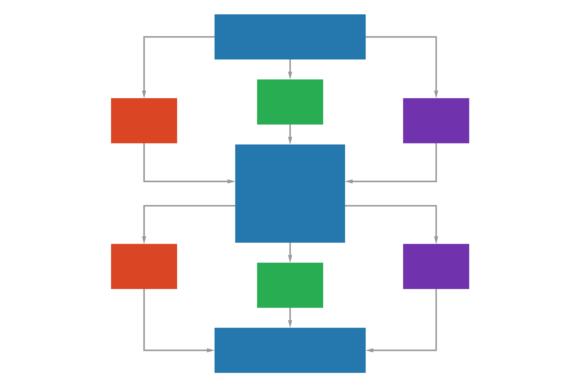
What Is an Infographic Element Connection Diagram?
An infographic element connection diagram is a visual framework that links individual data points, concepts, or components into a unified story. Instead of presenting isolated facts or separate charts, this type of diagram uses lines, arrows, nodes, and spatial relationships to show how pieces relate to one another. You might see it used in business strategy decks, educational materials, process workflows, or marketing collateral. The core idea is simple: meaning emerges from connection, not just collection.
For anyone who regularly communicates complex ideas visually, this kind of diagram offers a structured yet flexible way to guide the viewer’s eye and understanding. Whether you are building a slide for a client pitch, designing a classroom handout, or mapping out a personal project, the ability to show relationships clearly can make the difference between confusion and insight.
Why Different People Care About Connection Diagrams
Not everyone approaches an infographic element connection diagram with the same goal. A marketer might need to show how different campaign channels feed into a single conversion funnel. A teacher might want to illustrate cause and effect in a historical event. A startup founder could be mapping the flow of user data through a new app. The diagram itself is neutral; what matters is how well it serves the specific message and audience.
For beginners, the primary concern is usually ease of use. If you have never created a connection diagram before, you likely want something that feels intuitive rather than overwhelming. Templates that come pre-labeled with common structures like flowcharts, cycle diagrams, or network maps can reduce the learning curve significantly. A beginner might start by replacing placeholder text and colors, then gradually experiment with adding new nodes or adjusting line styles. The value here is in getting a professional-looking result without needing design training.
Experienced creators and designers tend to prioritize flexibility and control. They may want to break away from standard templates and build custom connection patterns that match their brand or data set exactly. For this group, the ability to adjust anchor points, curve lines, layer elements, and export in multiple formats like SVG, EPS, or transparent PNG matters a lot. They might use the diagram as a base layer in a larger composition, combining it with photography, icons, or custom typography. The diagram becomes a building block, not a finished product.
Professionals in business or consulting often focus on clarity and polish. Their audience may include executives or clients who need to grasp a strategic concept in seconds. Here, the connection diagram must be clean, color-coded logically, and free of visual clutter. A business consultant might use a connection diagram to show how operational changes affect revenue, customer satisfaction, and team workload simultaneously. The visual structure helps stakeholders see trade-offs and dependencies before making decisions.
For Educators and Trainers
If you teach a subject that involves processes, relationships, or systems, a connection diagram can replace paragraphs of explanation. For example, a biology instructor could use a node-and-arrow layout to show how photosynthesis converts sunlight into chemical energy, with each component linked to the next. Students often retain information better when they can trace a path visually. The diagram also becomes a reference sheet they can revisit later. When selecting a template, educators might prioritize labeling space, clear hierarchy, and the ability to print at different sizes without losing legibility.
For Small Business Owners and Entrepreneurs
Running a small business means you often have to explain your model to partners, investors, or new hires. A connection diagram can make your operations visible. Imagine mapping your order fulfillment process: customer order triggers inventory check, then payment processing, then packing, then shipping, then feedback collection. Each stage connects to the next, and bottlenecks become obvious. For someone with limited time, a ready-made diagram that already uses business-friendly color schemes and icons can save hours. The long-term usefulness comes from being able to update the diagram as your business grows.
For Marketers and Content Creators
Marketers regularly deal with multi-channel strategies and customer journeys. A connection diagram helps visualize how a user moves from awareness to purchase to advocacy. Different touchpoints can be represented as nodes, with arrows showing progression or decision points. A blogger might use a simpler version to show readers how different content pieces relate to each other, such as which posts serve as prerequisites or follow-ups. The commercial value here is in reducing friction for the audience. When people understand the relationship between pieces of information, they are more likely to engage deeply.
For Hobbyists and Personal Projects
Even outside of professional contexts, connection diagrams can be useful. Someone planning a family reunion could map tasks, deadlines, and responsible parties. A hobbyist learning to code might diagram how different functions call each other in a program. The emphasis here is usually on learning value and low cost. Free or low-cost templates with basic export options are often sufficient. The diagram becomes a thinking tool, not a presentation piece, so ease of editing and sharing matters more than pixel-perfect design.
Key Factors to Consider When Choosing a Diagram
Before downloading or building an infographic element connection diagram, it helps to think about your specific priorities. Different audiences weigh these factors differently.
Ease of Use
If your goal is speed and simplicity, look for templates that include pre-connected elements, color palettes, and clear instructions. Some diagrams come as editable vector files in formats like EPS or SVG, which allow you to change colors and text without redrawing anything. Others are raster images that require more work to modify. Beginners and busy professionals often prefer the first kind.
Quality and Presentation
For client-facing or published work, the diagram needs to look polished. This means consistent line weights, balanced spacing, readable fonts, and colors that align with your brand or message. High-resolution exports in transparent PNG or SVG allow you to overlay the diagram on different backgrounds without ugly borders. If you are printing on large format paper, vector formats like EPS or SVG scale cleanly to any size.
Flexibility and Customization
Advanced users may want to rearrange nodes, change connection styles, or add new elements that were not in the original template. In that case, a diagram built with editable vector paths gives you more freedom than a fixed layout. Some creators even use connection diagrams as starting points and then heavily modify them, changing shapes, adding gradients, or embedding icons inside nodes.
Commercial Value and Licensing
If you plan to use the diagram in a product you sell, such as an online course, a book, or a marketing template, check the license terms. Many resources allow personal and commercial use but may restrict resale of the diagram itself. Entrepreneurs and educators should verify this before committing to a specific file. Knowing you can legally use the diagram in your business saves headaches later.
Long-Term Usefulness
A good connection diagram is reusable. If the template is flexible enough to adapt to different topics, you can keep it in your toolkit for years. For example, a process flow layout might work equally well for explaining a manufacturing pipeline, a software workflow, or a decision tree. Professionals who create multiple presentations or documents benefit most from reusable assets.
Does an Infographic Element Connection Diagram Match Your Needs?
The answer depends on what you are trying to communicate and to whom. If your content involves relationships, sequences, networks, or dependencies, a connection diagram is likely a better fit than a simple bar chart or list. Ask yourself whether the audience needs to see how things connect in order to understand your message. If the answer is yes, then investing time in a good diagram pays off.
Consider your skill level honestly. If you are new to visual communication, start with a template that does most of the layout work for you. You can always learn more advanced techniques later as your confidence grows. If you are experienced, look for diagrams that offer deep customization without forcing you to fight the tool.
Also, think about the format you need. Will you display the diagram on a screen, print it, embed it in a video, or place it inside a larger document? Each use case may require a different file type. Transparent PNG works well for web and slide overlays. SVG is better for responsive web design and scaling. EPS is common for print workflows. Having the same diagram in multiple formats gives you the most flexibility.
Practical Steps to Get Started
If you decide an infographic element connection diagram fits your project, here is a simple path forward:
- Define your core message. What is the single most important relationship you want the audience to see?
- Choose a layout style. Flowchart, cycle, radial, network, or timeline each emphasize different kinds of connections.
- Select your file format. Match it to your delivery method and editing needs.
- Customize colors and labels. Keep contrast high and text concise.
- Test with a colleague or friend. Ask them to explain back what they see. If they miss the main point, adjust the visual hierarchy.
You do not need to be a designer to create effective connection diagrams. The structure itself does much of the communication work. Your job is to ensure the content inside the nodes and along the arrows is accurate and relevant.
Final Thoughts on Choosing the Right Diagram
An infographic element connection diagram is a practical tool, not a magic solution. Its value comes from how well it matches your message, your audience, and your own working style. Beginners appreciate the structure and time savings. Professionals value the precision and polish. Educators rely on the clarity. Business owners depend on the strategic overview. By understanding which of these perspectives aligns with your current situation, you can select a diagram that feels like a natural extension of your thinking rather than an extra task.
The best diagram is one that fades into the background, letting the relationships speak for themselves. When that happens, your audience stops looking at the graphic and starts understanding the idea. That shift is the real goal of any connection diagram, whether you are presenting to a boardroom, a classroom, or just yourself.